

Determining the cost and location of technical debt using measurements of velocity in a DevOps organisation.

Technical debt is defined (via Wikipedia) as:
The implied cost of additional rework caused by choosing an easy solution now instead of using a better approach that would take longer.
Many assume that this debt is solely found in the code and measure the Cyclomatic Complexity, Test Coverage and/or use a linter to determine how much debt there is and where it resides. These measures work well – but they don’t highlight which type of debt (complexity, lack of testing, poor documentation) cause the largest issues or where it is best to start. They will also fail to measure types of debt that are harder to spot, for example:
- Feature duplication
- The whole building-block is duplicated, but written differently, maybe in a different language
- No design-for-debug
- Debugging is hard when a fault occurs at arms-length (customer site, QA department) due to poor logging, error reporting or release/debug variation
- Slow test suite
- Test suite takes a long time to run, resulting in higher turnaround
- …
These possibly pull the standard definition of Technical Debt out a bit, so at Cristie we use the following:
The cost of additional work caused by choosing an easy solution now instead of using a better approach that would take longer.
This gives us a way to figure this out:
- If we assume that committing more frequently is preferable
(…and we say it is, and encourage people to do it…) - then the only reason for not committing more frequently is that you can’t
- and the reason you can’t we define to be our technical debt because
- if we re-factored, architected or otherwise improved then you could.
So we can measure technical debt as:
The amount of time spent on commits above α standard deviations that contain a file which is α standard deviations away from usual.
That is, the amount of extra time on commits containing files that routinely appear in commits that take longer.
Figuring out our commit history
We wrote a python script that processes subversion and git logs to produce:
- The commit author
- The business time since the author last committed in any repo
- The files in that commit
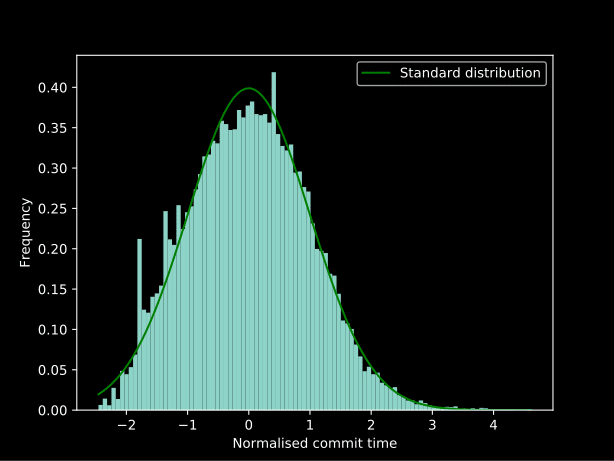
We then normalised these commits for each author and produced this graph:
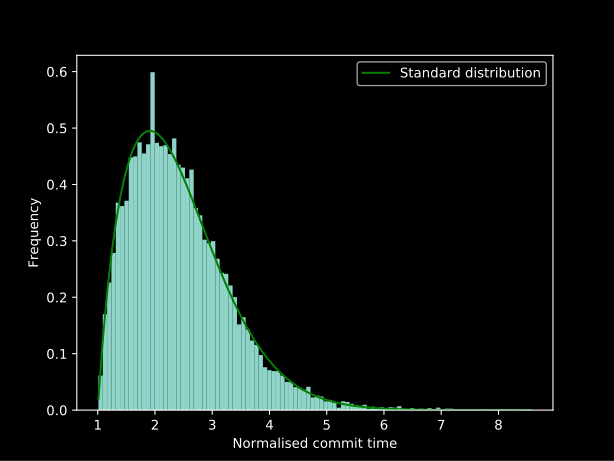
Some trial and error (there is definitely a better way to do it… but the statistics knowledge was learned during the experimentation) determined that applying lambda x: np.log(x) ** 2 as two concurrent Box-Cox transformations gives a very close normal distribution and applying this in reverse gets the best fit line in the graph above:
Technical debt
We can now figure out technical debt by calculating the z-score (a measure of how “normal” a population that should be normal is) for each file as:
[code lang=”python”]
def zscore(commits):
"Z-Score per-file for all files in commits"
perpath = collections.defaultdict(list)
for commit in commits:
for path in commit.paths:
perpath[path].append(commit.interval)
return {path : sum(perpath[path]) / math.sqrt(len(perpath[path]))}
[/code]
which means we can calculate the interest we’re paying on technical debt:
[code lang=”python”]
def debt(commits, deviation=1):
"Total debt for this series of commits"
scores = zscore(commits)
debt = 0
for commit in commits:
for path in commits.paths:
if scores[path] > deviation:
debt += commit.duration –
inverse(0) –
inverse(deviation)
return debt * 100.0 / sum(c.duration for c in commits)
[/code]
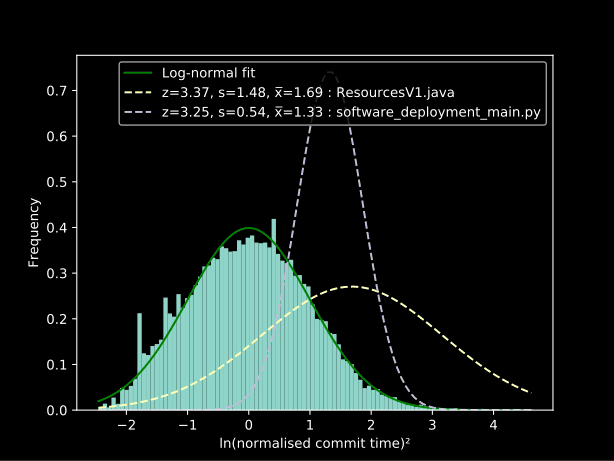
By using a sliding window we can produce a graph of technical debt over time and find the files that contribute to this. The following shows the population of commits for the high interest files in comparison to normal:
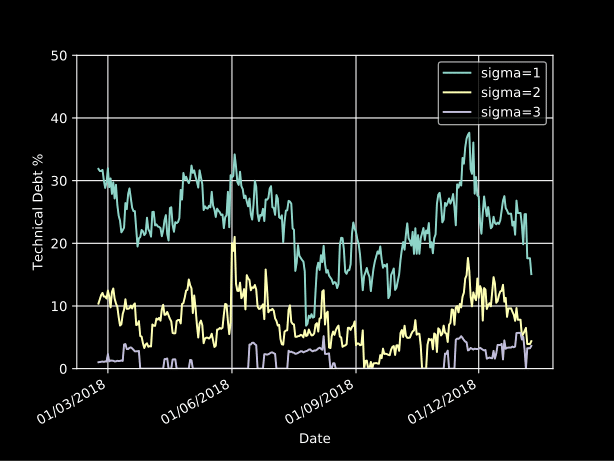
Results
Technical debt from 2018 is hovering around 20%:
More importantly this gives us a list of files we need to work on (edited to protect the innocent):
| Z-Score | % Commits | Multiplier | Filename | |
|---|---|---|---|---|
| 3.18 | 1.66 % | 2.44x | Appliance Dockerfile | |
| 0.82 | 4.76 % | 2.14x | Licensing code for new product | |
| 2.94 | 0.98 % | 2.15x | Remote python REST API |
In the above cases we agreed throughout the team that these had been problematic areas. Our diagnosis in order was:
- Appliance Dockerfile
- The appliance size was too large, so pulling down the required packages from Nexus over the network resulted in a large delay in the round-trip.
We significantly reduced the appliance size to counter this. - Licensing code for new product
- This code was bought in and had a number of issues:
- Mismatching compilation of 32/64 bit and big/little endian architectures
- Duplicated, but similarly named functions, e.g.
CheckLicencevscheck_licence - Misleading names (
dsUint32_tis actually just anint…)
We refactored this code extensively and added tests to clear this up.
- Remote python REST API
- This had a high cyclic complexity and low documentation but, most importantly, had a high integration test turnaround time.
This has been improved by removing some of the stages in the integration test performed for each test.
Arguments against this approach
What about things that don’t go in version control?
First off… everything should be in version control! Easy. Of course, there are always actions that aren’t – but these are either independent of the current commit (so won’t affect the data when taken in volume) or do affect the current commit – in which case they are technical debt.
What if some people take more care than others?
We normalise on a per-author basis to try and make our data about the code and process, rather than the individual.
Interest is only paid when code is currently active, so a drop in interest may just mean the current active code is better
This is very true… and is definitely an issue. Inactive code with high technical debt represents risk but isn’t actually holding things back… yet. This is where secondary metrics (complexity, coverage and linting) can help – particularly if a link to the empirical measure of debt can be found. …watch this space.